IMRAD

Overview of IMRaD structure

IMRaD refers to the standard structure of the body of research manuscripts (after the Title and Abstract). This consists of: 

  • Introduction
  • Materials and Methods
  • Results
  • Discussion and Conclusions

Not all journals use these section titles in this order, but most published articles have a structure similar to IMRaD. This standard structure:

  • Gives a logical flow to the content
  • Makes journal manuscripts consistent and easy to read
  • Provides a “map” so that readers can quickly find content of interest in any manuscript
  • Reminds authors what content should be included in an article
  • Provides all content needed for the work to be replicated and reproduced

Although the sections of the journal manuscript are published in the order: Title, Abstract, Introduction, Materials and Methods, Results, Discussion, and Conclusion, this is not the best order for writing the sections of a manuscript. One recommended strategy is to write your manuscript in the following order:

  1. Materials and Methods
  2. Results 
    1. You can write these first, as you are doing your experiments and collecting the results.
  3. Introduction
  4. Discussion
  5. Conclusion 
    1. Write these sections next, once you have had a chance to analyse your results, have a sense of their impact and have decided on the journal you think best suits the work.
  6. Title
  7. Abstract

Write your Title and Abstract last as these are based on all the other sections. Following this order will help you write a logical and consistent manuscript. Use the different sections of a manuscript to ‘tell a story’ about your research and its implications.

NextReferences & Article Types

For further support

We hope that with this tutorial you have a clearer idea of how the publication process works and feel confident in responding to editor and reviewers. Good luck with publishing your work!

If you feel that you would like some further support with writing your paper and understanding the peer review process, Springer Nature offer some services which may be of help.

  • Nature Research Editing Service offers high quality  English language and scientific editing. During language editing, Editors will improve the English in your manuscript to ensure the meaning is clear and identify problems that require your review. With Scientific Editing experienced development editors will improve the scientific presentation of your research in your manuscript and cover letter, if supplied. They will also provide you with a report containing feedback on the most important issues identified during the edit, as well as journal recommendations.
  • Our affiliates American Journal Experts also provide English language editing* as well as other author services that may support you in preparing your manuscript.
  • We provide both online and face-to-face training for researchers on all aspects of the manuscript writing process.

source : https://www.springernature.com/gp/authors/campaigns/writing-a-manuscript/structuring-your-manuscript

Update Journal Management – WebofScience (2019)

  • Update 2019
  • Information System:
  • Management Information Systems Quarterly MISQ(Q1)
  • Information Systems Research ISR(q1/Q2)
  • Journal of Management Information Systems JMIS(Q1)
  • Journal of the Association for Information Systems JAIS(Q2)
  • European Journal of Information Systems EJIS(Q2)
  • Decision Support Systems DSS(Q1)
  • Information & Management – I&M(Q1) -SJR
  • Information Systems Journal ISJ(Q1)
  • International Journal of Electronic Commerce IJEC(Q2)
  • Operation Management:
  • Management Science(Q1)
  • Journal of operations management(Q1)
  • Decision Sciences(Q3)
  • International Journal of Production Research(Q1)
  • International Journal of Production Economics(Q1)
  • European Journal of Operational Research(Q1)
  • Computers & Operations Research(Q2)
  • International Journal of Production Economics(Q1)
  • International Journal of Logistics Management(Q2)
  • Journal of Business Logistics(Q1)
  • Transportation Research Part E-Logistics and Transportation Review(Q1)
  • International Journal of Physical Distribution & Logistics Management(Q1)
  • Marketing:
  • Journal of Marketing(Q1)
  • Journal of Marketing Research(Q1)
  • Journal of the Academy of Marketing Science(Q1)
  • Journal of Retailing(Q1)
  • International Journal of Research in Marketing(Q2)
  • Journal of Business Research(Q1)
  • Journal of Consumer Research(Q1)
  • Business Strategy and The Environment (Q1)
  • General Management:
  • Academy of Management Review(Q1)
  • Administrative Science Quarterly(Q1)
  • Academy of Management Journal(Q1)
  • Strategic Management Journal(Q1)
  • Organization Science(Q2)
  • Research Policy(Q1)
  • Journal of Management(Q1)
  • Journal of Management Studies(Q1)
  • IEEE Transactions on Engineering Management(Q2)
  • MIT Sloan Management Review(Q2)

Perbedaan indikator Reflektif dan Formatif

Masalah mengukur variabel laten atau konstruk saat ini menjadi perdebatan utama dalam penelitian sosial seperti bidang pemasaran, sistem informasi, akuntansi (lihat Bisde dkk., 2007), dan sebagainya. Pertanyaan utamanya adalah apakah indikator menjadi penyebab dari (causing) atau disebabkan (being caused) oleh konstruk atau variabel laten yang diukur? Terdapat dua tipe operaionalisasi atau pengukuran konstruk seperti gambar dibawah ini:

Gambar diatas menilustrasikan bahwa peneliti sering menghadapi kebingungan dalam operasional variabel laten penelitiannya. Secara umum, karakteristik dari konstruk formatif adalah perubahan dalam kontstruk tersebut akan menyebabkan perubahan-perubahan dalam indikator-indikatornya.

Disebut reflektif (kadang disebut manifest) karena indikator merupakan perwujudan atau refleksi dari konstruknya. Sebagai contoh, variabel laten stres karena pekerjaan dapat terefleksi dalam indikator-indikator seperti malas berangkat ke kantor, ingin pindah kerja, dan tidak dapat menyelesaikan pekerjaan tepat waktu. Konstruk formatif mempunyai karkateristik bahwa perubahan dalam indikator akan menyebabkan perubahan dalam konstruk. Indikator-indikator dalam hal ini menjadi penyebab atau membentuk konstruk. Misalnya, banyaknya target yang harus diselesaikan, sikap atasan, rendahnya gaji, dan lingkungan kerja dapat menjadi indikator formatif stress pekerjaan.

Karakteristik indikator-indikator reflektif adalah mirip dan dapat dipertukarkan (intercangeable). Dengan kata lain, kemiripan atau overlap antar indikator tidak menjadi masalah dan justru seharusnya dimaksimalkan oleh peneliti. Oleh karena itu membuang indikator reflektif tidak menjadi masalah dan tidak mengubah esensi konstruk. Hal ini karena masih ada indikator-indikator lain yang mempunyai karaktersitik sama.

Sebaliknya, indikator-indikator konstruk formatif umumnya mempunyai kandungan yang berbeda. Masing-masing indikator bersifat unik dan tidak dapat dipertukarkan. Oleh karena itu, membuang salah satu indikator formatif dapat menjadi masalah karena akan mengubah esensi konstruk. Dalam pengukuran formatif, peneliti seharusnya berupaya meminimalkan kemiripan atau over/ap antar indikator.

Metode pengukuran konstruk tergantung pada konseptualisasi konstruk dan tujuan penelitian. Disajikan ilustrasi bahwa satu konstruk (misalnya kepuasan menginap disuatu hotel) dapat diukur secara reflektif maupun formatif. Terdapat beberapa indikator formatif yang mungkin dapat digunakan (panah dari indikator ke konstruk) dan indikator reflektif (panah dari kontruk ke indikator).

Berikut adalah panduan singkat (Rule of Thumb) memilih pengukuran reflektif dan formatif (hair dkk. 2013).

Kriteria Keputusan
(1)Apakah indikator merupakan konsekuensi atau
penyebab kunstruk?

(2)Apakah konstruk meupakan sebuah sifat yang menjelakan indikator atau kombinasi dari indikator?

(3)Apakah jika penilaian konstruk beubah maka semua indikator akan berubah dalam pola yang sama?

(4)Apakah indikator dapat dipertukarkan secara sama?
(1)Jika konsekuensi: reflektif Jika penyebab: formatif

(2)Jika sifat: reflektif Jika kombinasi: formatif

(3)Jika ya: reflektif
Jika tidak: formatif

(4)Jika ya: reflektif Jika tidak: formatif
(sumber:Mahfud Sholihin, Ph.D 2013. Dr. Dwi Ratmono Analisis SEM-PLS dengan WarpPLS3.0. Yogyakarta)

‘Sumber : https://jasastatistikbandung.com/2020/04/05/perbedaan-indikator-reflektif-dan-formatif/”

Convergent and divergent validity

Convergent validity and divergent validity are ways to assess the construct validity of a measurement procedure (Campbell & Fiske, 1959). If you are unsure what construct validity is, we recommend you first read: Construct validity. Convergent validity helps to establish construct validity when you use two different measurement procedures and research methods (e.g., participant observation and a survey) in your dissertation to collect data about a construct (e.g., anger, depression, motivation, task performance). Divergent validity helps to establish construct validity by demonstrating that the construct you are interested in (e.g., anger) is different from other constructs that might be present in your study (e.g., depression). To assess construct validity in your dissertation, you should first establish convergent validity, before testing for divergent validity. In this article, we explain what convergent and divergent validity are, providing some examples.

What is convergent validity?

Convergent validity helps to establish construct validity when you use two different measurement procedures and research methods (e.g., participant observation and a survey) in your dissertation to collect data about a construct (e.g., anger, depression, motivation, task performance). The extent to which convergent validity has been demonstrated is establish by the strength of the relationship between the scores that are obtained from the two different measurement procedures and research methods that you have used to collect data about the construct you are interested in. The idea is that if these scores convergedespite the fact that we use two different measurement procedures and research methods, we must be measuring the same construct.

We use the words, despite the fact, because it can be difficult enough in research to create one reliable operational definition for a construct; that is, a single reliable way of measuring a particular construct. It’s one thing to suggest measuring the construct height using centimetres, or a person’s weight using kilograms, but these are operational definitions of constructs that are quite obvious, where it is easy to come up with a single operational definition. It is far more challenging to create reliable operational definitions for constructs like anger, depression, motivation, and task performance, let alone multiple operational definitions [see the article on Constructs in quantitative research]. However, in order to establish convergent validity, we must come up with two operational definitions of the construct we are interested in. We have to come up with two operational definitions because we are using two different measurement procedures (e.g., with participant observation and a survey as the research methods). Each of these measurement procedures will require a different operational definition. Let’s look at an example:

Study #1
Construct #1 = Sleep quality


Imagine that we are interested in studying the relationship between fitness level and sleep quality; that is, the impact that exercise has on how well people sleep. For the purpose of this example, let’s focus on the scores on the dependent variable, which is sleep quality (i.e., sleep quality is the construct of interest). When participants in the study wake up in the morning, they record their sleep quality using a self-completed survey (i.e., they fill in a questionnaire). This gives us insight into how well the participants felt they slept. However, is this a reliable measurement procedure to measure the construct, sleep quality? Let’s imagine that we are simply unsure because sometimes self-completed measurement procedures can be prone to certain biases. Therefore, we also observe the participants whilst they are sleeping using a video camera to monitor their sleeping patterns. When making the observations, we score the participants’ sleep quality. We hope that by using two different research methods to assess sleep quality, we will have a more reliable measurement procedure for the construct we are interested in.

This leaves us with two different sets of scores from the two different measurement procedures used under the two research methods (i.e., the scores from the survey and the scores from the participant observation). We will have started to demonstrate convergent validity if there is a strong relationship between the two scores (i.e., the scores from the measurement procedures used under the two different research methods). Such a strong relationship, which helps to demonstrate convergent validity, is an important step in assessing construct validity; that is, we can be more confident that the measurement procedures that we are using to measure sleep quality are a valid measure of the construct, sleep quality.

In order to establish convergent validity, the strength of the relationship between the scores from the two different measurement procedures, from the two different methods, is assessed. This is usually achieved by calculating a correlation between the two scores.

NOTE: Convergent validity is not the same as concurrent validity, which we discuss in more detail in the article: Concurrent validity. However, the distinction is quite straightforward. Both convergent and concurrent validity are ways of assessing construct validity by examining the strength of the relationship between the scores from two different measurement procedures. However, whilst concurrent validity compared a new measurement procedure with a well-established measurement procedure, both measurement procedures are new when testing for convergent validity. Therefore, if one of the measurement procedures you are using to establish construct validity is well-established, you should read the article: Concurrent validity.

What is divergent validity?

Divergent validity helps to establish construct validity by demonstrating that the construct you are interested in (e.g., anger) is different from other constructs that might be present in your study (e.g., depression). To assess construct validity in your dissertation, you should first establish convergent validity, before testing for divergent validity.

Divergent validity is important because it is common to come up with an operational definition for a construct that actually measures more than one construct. Unfortunately, we are typically not aware that this has happened; after all, if we had, we wouldn’t have made the mistake in the first place; that is, we would have come up with a more reliable operational definition. For example, we think that the questions we ask in a survey about the construct, anger, only measure anger, when in fact they also measure another construct, depression. In order to establish that the scores we obtained when collecting data reflect anger and not depression, we need to test for the divergent validity of the measurement procedures we used to capture anger and depression. To do this, we will have two different measurement procedures and research methods to measure both constructs we are examining. This could mean that we have a total of four measurement procedures, but often you will have used the same research method to collect data for both constructs (e.g., you used participant observation to measure both anger and depression amongst your sample, following this up with a survey, which included questions also measuring both anger and depression).

The extent to which divergent validity has been demonstrated is establish by the strength of the relationship between the scores that are obtained from the two different measurement procedures and research methods that you have used to collect data about the two constructs you are interested in. Unlike convergent validity, where we are interested in the extent to which the scores converge (i.e., we want to see a strong relationship between the two scores on the same construct), with divergent validity, we are interested in the extent to which the scores diverge (i.e., we want to see little or no relationship between the two scores from the two constructs). This is a two-step process:

  1. Establish convergent validity: A strong relationship should be established between the two scores for each of the two constructs (e.g., a strong relationship for anger and a strong relationship for depression).
  2. Establish divergent validity: Little or no relationship should be found between the two scores between the two constructs (e.g., little or no relationship between anger and depression) when comparing the same methods used to collect the data (e.g., comparing anger and depression from the observational scores, and comparing anger and depression from the survey scores).

Let’s look at an example:

Study #2
Construct #1 = Sleep quality
Construct #2 = Sleep quantity
Note: Quality vs. Quantity of Sleep

Let’s imagine that in Study #1 we were able to establish a strong relationship between the two sets of scores from the two different measurement procedures under the two research methods (i.e., the scores from the survey and the scores from the participant observation); in other words, we started to establish convergent validity for the construct, sleep quality. However, now that we look back at Study #1, we are concerned that we included sleep quantity within the same set of measures (e.g., the questions in the survey) that we used when measuring sleep quality. We say that we are concerned about including these measures within the same measurement procedure because we are unsure whether sleep quality and sleep quantity are part of the same construct or are two different constructs (i.e., let’s imagine that no previous studies are able to answer this question for us). Now if sleep quality and sleep quantity are two different constructs, but we measured them as if they were the same construct, we have introduced a confounding variable that will inevitably reduce the internal validity of our study [see the articles: Extraneous and confounding variables and Internal validity]. Therefore, we decided to examine whether sleep quality and sleep quantity are different constructs.

To achieve this, we use the same research methods as in Study #1; that is, we ask participants to complete a survey, as well as observing participants whilst sleeping. However, the survey contains (a) questions that measure sleep quality and (b) questions that measure sleep quantity. Similarly, when we observe participants, we record scores separately for (a) sleep quality and (b) sleep quantity. In order to assess whether the two constructs (i.e., sleep quality and sleep quantity) are different, we first need to find that both constructs have convergent validity. Therefore, there should be a strong relationship between the survey scores and observational scores for (a) sleep quality and (b) sleep quantity. Next, we need to find that these two constructs are distinct; that is, that we have divergent validity. Therefore, there should be little or no relationship between (a) the survey scores for sleep quality and the survey scores for sleep quantity and (b) the observational scores for sleep quality and the observational scores for sleep quantity. If this is the case, we can be more confident that sleep quality and sleep quantity are, in fact, two separate constructs. Since we had to establish convergent validity before we could establish divergent validity, we can also be satisfied that we have created two valid measurement procedures for sleep quality and sleep quantity (i.e., a survey and observational measurement procedure for sleep quality, and a survey and observational measurement procedure for sleep quantity).

Construct validity can start to be established when you:

  1. Find that the scores that are obtained from the measurement procedures you used from two different methods to assess the construct you are interested in are strongly related; that is, the scores converge, suggesting that both measurement procedures reflect the construct you are interested in, establishing convergent validity.
  2. Find that the scores obtained for the two constructs you are interested in diverge (i.e., are unrelated); that is, there is little or no relationship between the scores for the two constructs when comparing these scores using the same methods. This establishes divergent validity.

We say that construct validity can start to be established when both convergent and divergent validity are established because construct validity is something that is built over time. No single study can establish construct validity [see the article: Construct validity].

Source :

https://dissertation.laerd.com/convergent-and-divergent-validity-p2.php

https://dissertation.laerd.com/convergent-and-divergent-validity.php

Validity

1 Validity

2 Determining Validity

There are several ways to measure validity. The most commonly addressed include:- Face Validity- Construct & Content Validity- Convergent & Divergent Validity- Predictive Validity- Discriminant Validity

3 Validity Refers to measuring what we intend to measure.
If math and vocabulary truly represent intelligence then a math and vocabulary test might be said to have high validity when used as a measure of intelligence.

4 Face Validity Is the extent to which it is self-evident that a scale is measuring what it is suppose to measure.For Example – you might look at a measure of math ability, read through the questions, and decide that yep, it seems like this is a good measure of math abilityIt would clearly be weak evidence because it is essentially a subjective judgment call. Just because it is weak evidence doesn’t mean that it is wrong. We need to rely on our subjective judgment throughout the research process.For example- suppose you were taking an instrument reportedly measuring your attractiveness, but the questions were asking you to identify the correctly spelled word in each list. Not much of a link between the claim of what it is supposed to do and what it actually does.

5 Face Validity (cont.)The question is not whether it is measuring what it is supposed to measure, but whether it appears to measure what it is supposed to be measuring.Face validity is important for some tests. If examinees are not interested or do not see the relevance of a particular test, they may not take it seriously or participate to the best of their abilities.

6 Face Validity (cont.)In all cases, face validity is not based on empirical research evidence.When used alone, face validity provides very weak support for the overall validity of a scale.We can improve the quality of face validity assessment considerably by making it more systematic. For instance, if you are trying to assess the face validity of a math ability measure, it would be more convincing if you sent the test to a carefully selected sample of experts on math ability testing and they all reported back with the judgment that your measure appears to be a good measure of math ability.

7 Face Validity (cont.) Possible Advantage of face validity…
If the respondent knows what information we are looking for, they can use that “context” to help interpret the questions and provide more useful, accurate answers.Possible Disadvantage of face validity…If the respondent knows what information we are looking for, they might try to “bend & shape” their answers to what they think we want.i.e., “fake good” or “fake bad”

8 Content ValidityDoes the test contain items from the desired “content domain”?Based on assessment by experts in that content domain.Is especially important when a test is designed to have low face validity.Is generally simpler for “other tests” than for “psychological constructs”For Example – Easier for math experts to agree on an item for an algebra test than it is for psych experts to agree whether or not an item should be placed in a EI or a personality measure.Content Validity is not “tested for”. Rather it is assured by experts in the domain.

9 Content Validity (cont.)
Basic Procedure for Assessing Content Validity:1. Describe the content domain2. Determine the areas of the content domain that are measured by each test item3. Compare the structure of the test with the structure of the content domainFor Example – In developing a nursing licensure exam, experts on the field of nursing would identify the information and issues required to be an effective nurse and then choose (or rate) items that represent those areas of information and skills.

10 Content Validity (cont.)
Lawshe (1975) proposed that each rater should respond to the following question for each item in content validity:Is the skill or knowledge measured by this item1. Essential2. Useful but not essential3. Not necessaryFor Example – With respect to educational achievement tests a test is considered content valid when the proportion of the material covered in the test approximates the proportion of material covered in the course.

11 Construct ValidityConstruct Validity basically refers to the general validity of the measurement tool.Does the instrument measure the construct that it is intended to measure?There is no statistical test that will provide an absolute measure for construct validity. Therefore, construct validity is never proven, it can only be supported.

12 ConstructsAre ideas that help summarize a group of related phenomenon or objects.All constructs have 2 essential properties:1. Are abstract summaries of some regularity in nature.2. Related with concrete, observable entities.For Example – Integrity is a construct; it cannot be directly observed, yet it is useful for understanding, describing, and predicting human behaviour.

13 Operational Definitions
An operational definition is a formula (recipe) for building a construct in a way that other scientists can duplicate.e.g. Depression is defined by concepts of the DSM IV, Intelligence is defined by a specified test made up of logical relationships, short term memory, word associations.The definition must be clear.Must allow people to apply it.One problem with operational definitions – if we don’t like the operational definition, there is nothing to prevent us from giving the variable another one.

14 Psychological Constructs
Psychological measurement is a process based on concrete, observable behaviour.Construct Explication – process of providing a detailed description of the relationship between specific behaviors and abstract constructs. This process consists of 3 steps:1. Identify behaviours related to the construct.2. Identify other constructs and decide whether they are related or unrelated to the construct being measured.3. Identify behaviours that are related to the additional constructs & determine if these are related or unrelated to the construct being measured. (Example p. 157)

15 Construct ValidityThink of a construct as something that is like an idea or mental map that we are trying to understand.For example – intuition is a construct. There is no place on the brain (as of yet) that can be identified as Intuition. But we see lots of behaviors that seem to be expressions of some quality we call Intuition. Is there evidence for the claim that the construct is real and operates in our life?So, to test certain constructs we have to collect lots of evidence. Usually, the evidence is collected by correlating the instrument in question with lots of other instruments thought to measure a similar thing and with some that say they don’t measure the same thing.

16 Construct Validity (cont.)
Attention to construct validity reminds us that our defense of the constructs we create is really based on the “whole package” of how the measures of different constructs relate to each other.So construct validity “begins” with content validity (are these the right type of items) and then adds the question, “does this test relate as it should to other tests of similar and different constructs?

17 Measuring Construct Validity
Construct Validity involves comparing a new measure to an existing, valid measure.Usually existing valid measures don’t exist. That is often why the new scale is being created in the first place.Sometimes, however, a valid measure will exist but a new scale is being created that will have some advantage over the older measure More up-to-date with current theory Shorter A new alternative measure

18 Discriminant Validity
The statistical assessment of Construct Validity…Does the instrument show the “right” pattern of interrelationships with other instruments.e.g., It would be expected that individuals diagnosed with clinicaldepression would score significantly worse on a valid depression scalethan would individuals who received no such diagnosis.Discriminant Validity has two parts:Convergent ValidityDivergent Validity

19 Convergent & Divergent Validity
Convergent Validity: the extent to which the scale correlates with measures of the same or related concepts e.g., A new scale to measure Assertiveness should correlate with existing measures of Assertiveness, and with existing measures of related concepts like Independence.Divergent Validity: the extent to which does not correlate with measures of unrelated or distinct concepts e.g., An assertiveness scale should not correlate with measures of aggressiveness.

20 A Test Must Be Valid – Discriminant Validity
Test-to-test correlations can range from 0.0 to near 1.0.r = .00 to .25 unrelated to minimally relatedr = .25 to .50 minimal to moderate overlapr = .50 to .75 moderate to high overlapr = .75 and highly overlapping to equivalent…even tests that are highly overlapping-to-equivalent may have subtle differences that are of theoretical interest (especially at the lower ranges).- from the MSCEIT Manual

21 Multitrait-Multimethod Matrix
The multitrait-multimethod (MTMM) matrix [Campbell & Fiske (1959)] is one of the methods used to assess a test’s construct validity.It is a matrix of correlation coefficients and provides information on convergent and divergent validity.Uses a number of different methods to measure more than one construct (e.g., observations, surveys, rating scales).For Example – Graph on pg. 163 of textbook

22 Criterion-Related Validity
A criteria is a measure that could be used to determine the accuracy of a decision.Criterion-related validity indicates the degree of the relationship between the predictor (the test) and a criterion (level of performance the test is trying to predict). e MSCEIT ManualThe predictor is a tool that is used to predict the criterion.

23 Criterion-Related Validity (cont.)
This type of validity measures the relationship between the predictor and the criterion, and the accuracy with which the predictor is able to predict performance on the criterion.For our example, the company psychologist would measure the job performance of the new artists after they have been on-the-job for 6 months. He or she would then correlate scores on each predictor with job performance scores to determine which one is the best predictor.

24 Criterion-Related Validity (cont.)
HOW THIS TYPE IS ESTABLISHED: Criterion-related validity can be either concurrent or predictive. The distinguishing factor is the time when criterion and predictor data are collected.Concurrent – criterion data are collected before or at the same time that the predictor is administered.Predictive – criterion data are collected after the predictor is administered. Manual

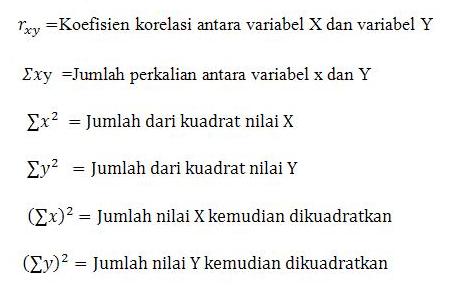
25 Concurrent ValidityThis type of validity indicates the correlation between the predictor and criterion when data on both were collected at around the same time.Is used to determine a person’s current status.For Example – to assess the validity of a diagnostic screening test. In this case the predictor (X) is the test and the criterion (Y) is the clinical diagnosis. When the correlation is large this means that the predictor is useful as a diagnostic tool.Concurrent validity are practical, easy to conduct, test scores are obtained immediately if needed.

26 Predictive ValidityThis type of validity also indicates the correlation between the predictor (X) and the criterion (Y). However, criterion data are collected after predictor data are obtained. In other words, this method determines the degree, that X can accurately predict YFor Example – giving high school juniors the ACT test for admission to a university.The test is the predictor and first semester grades in college are the criterion. If the correlation is large, this means the ACT is useful for predicting future grades.

27 Predictive Validity (cont.)
The extent to which scores on the scale are related to, and predictive of, some future outcome that is of practical utility.e.g., If higher scores on the SAT are positively correlated withhigher G.P.A.’s and visa versa, then the SAT is said tohave predictive validity.The Predictive Validity of the SAT is mildly supported by the relation of that scale with performance in graduate school.

28 Predictive ValidityA predictive validity study consists of two basic steps:1. Obtain test scores from a group of respondents, but do not use the test in making a decision.2. At some later time, obtain a performance measure for those respondents, and correlate these measures with test scores to obtain predictive validity.

29 Examples of Predictive Validity
For instance, we might theorize that a measure of math ability should be able to predict how well a person will do in an engineering-based profession.We could give our measure to experienced engineers and see if there is a high correlation between scores on the measure and their salaries as engineers.A high correlation would provide evidence for predictive validity — it would show that our measure can correctly predict something that we theoretically thing it should be able to predict.

30 A Test Must Be Valid – Predictive Validity
When evaluating test to real-life predictions, even very modest correlations of r = .02 or .03 can be of considerable importance. For example, the impact of chemotherapy on breast cancer survival is r = .03.In selection, hiring, and counseling contexts, current interpretations suggest that correlations as low as r = .02 or .03 are meaningful, with many psychological (and medical test) assessments and real life criteria falling in the r = .10 to .30 level, and a few rising beyond that level.- from the MSCEIT Manual

31 FACTORS THAT INFLUENCE VALIDITY
Inadequate sampleItems that do not function as intendedImproper arrangement/unclear directionsToo few items for interpretationImproper test administrationScoring that is subjective

32 Meta-AnalysisRefers to the method for combining research results from large number of studies. Especially in studies where conflicting findings abound.Rarely do large numbers of studies use precisely the same tests and criterion measures, and it is necessary to make judgements about which studies should be grouped together.AdvantagesGives an overall estimate of validity – especially helpful with predictive validity studiesMore definitive than the traditional ways of conducting literature review.Larger sample sizes

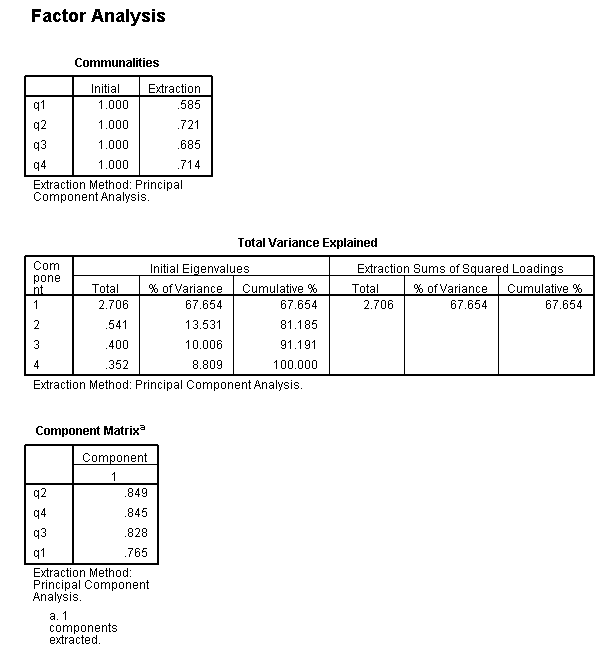
33 Factor AnalysisA factor is a combination of variables that are intercorrelated and thus measure the same characteristicIs a statistical technique used to analyze patterns of correlations among different measures.- MSCEIT ManualThe principal goal of factor analysis is to reduce the numbers of dimensions needed to describe data derived from a large number of data.It is accomplished by a series of mathematical calculations, designed to extract patterns of intercorrelations among a set of variables.Not all constructs have underlying factors

34 Factor Analysis The two most commonly used Factor Analysis Methods:
Exploratory Factor Analysis – typically entails estimating, or extracting factors; deciding how many factors to retain. Is a statistical technique used to analyze patterns of correlations among different measures.Confirmatory Factor Analysis – a factor structure is tested for its fit (e.g., goodness of fit).- MSCEIT Manual

35 Factor Analysis Possible Advantages Simplifies interpretation
Can learn more about the composition of variablesPossible DisadvantagesDo the combining of factors capture the essential aspects of what is being measured?Are the factors generalizable to other populations (e.g., different cultures, gender, individuals with disabilities

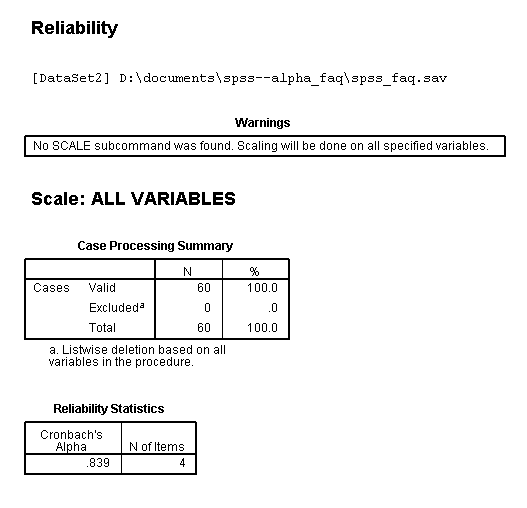
36 RELIABILITY AND VALIDITY
RELATIONSHIP BETWEENRELIABILITY AND VALIDITYReliability means nothing when the problem is Validity.

37 Relationship Between Reliability & Validity
Reliability and validity are two different standards used to gage the usefulness of a test. Though different, they work together.It would not be beneficial to design a test with good reliability that did not measure what it was intended to measure. The inverse, accurately measuring what you desire to measure with a test that is so flawed that results are not reproducible, is impossible.Reliability is a necessary requirement for validity. This means that you have to have good reliability in order to have validity. Reliability actually puts a cap or limit on validity, and if a test is not reliable, it can not be valid.- from the MSCEIT Manual

38 Relationship Between Reliability & Validity
Establishing good reliability is only the first part of establishing validity.Validity has to be established separately. Having good reliability does not mean you have good validity, it just means you are measuring something consistently.Now you must establish what it is that you are measuring consistently. The main point here is reliability is necessary but not sufficient for validity.

39 Relationship Between Reliability & Validity
Tests that are reliable are not necessarily valid or predictive.If the reliability of a psychological measure increases, the validity of the measure is also expected to increase.- from the MSCEIT Manual

source : https://slideplayer.com/slide/5809201/

uji validitas

Validitas berasal dari kata validity yang mempunyai arti sejauh mana ketepatan dan kecermatan suatu alat ukur dalam melakukam fungsi ukurannya (Azwar 1986). Selain itu validitas adalah suatu ukuran yang menunjukkan bahwa variabel yang diukur memang benar-benar variabel yang hendak diteliti oleh peneliti (Cooper dan Schindler, dalam Zulganef, 2006).

Sedangkan menurut Sugiharto dan Sitinjak (2006), validitas berhubungan dengan suatu peubah mengukur apa yang seharusnya diukur. Validitas dalam penelitian menyatakan derajat ketepatan alat ukur penelitian terhadap isi sebenarnya yang diukur. Uji validitas adalah uji yang digunakan untuk menunjukkan sejauh mana alat ukur yang digunakan dalam suatu mengukur apa yang diukur. Ghozali (2009) menyatakan bahwa uji validitas digunakan untuk mengukur sah,  atau valid tidaknya suatu kuesioner. Suatu kuesioner dikatakan valid jika pertanyaan pada kuesioner mampu untuk mengungkapkan sesuatu yang akan diukur oleh kuesioner tersebut.

Suatu tes dapat dikatakan memiliki validitas yang tinggi jika tes tersebut menjalankan fungsi ukurnya, atau memberikan hasil ukur yang  tepat dan akurat sesuai dengan maksud dikenakannya tes tersebut. Suatu tes menghasilkan data yang tidak relevan dengan tujuan diadakannya pengukuran dikatakan sebagai tes yang memiliki validitas rendah.

Sisi lain dari pengertian validitas adalah aspek kecermatan pengukuran. Suatu alat ukur yang valid dapat menjalankan fungsi ukurnya dengan tepat, juga memiliki kecermatan tinggi. Arti kecermatan disini adalah dapat mendeteksi perbedaan-perbedaan kecil yang ada pada atribut yang diukurnya.

Dalam pengujian validitas terhadap kuesioner, dibedakan menjadi 2, yaitu validitas faktor dan validitas item. Validitas faktor diukur bila item yang disusun menggunakan lebih dari satu faktor (antara faktor satu dengan yang lain ada kesamaan). Pengukuran validitas faktor ini dengan cara mengkorelasikan antara skor faktor (penjumlahan item dalam satu faktor) dengan skor total faktor (total keseluruhan faktor).

Validitas item ditunjukkan dengan adanya korelasi atau dukungan terhadap item total (skor total), perhitungan dilakukan dengan cara mengkorelasikan antara skor item dengan skor total item. Bila kita menggunakan lebih dari satu faktor berarti pengujian validitas item dengan cara mengkorelasikan antara skor item dengan skor faktor, kemudian dilanjutkan mengkorelasikan antara skor item dengan skor total faktor (penjumlahan dari beberapa faktor).

Dari hasil perhitungan korelasi akan didapat suatu koefisien korelasi yang digunakan untuk mengukur tingkat validitas suatu item dan untuk menentukan apakah suatu item layak digunakan atau tidak. Dalam penentuan layak atau tidaknya suatu item yang akan digunakan, biasanya dilakukan uji signifikansi koefisien korelasi pada taraf signifikansi 0,05, artinya suatu item dianggap valid jika berkorelasi signifikan terhadap skor total.

Untuk melakukan uji validitas ini menggunakan program SPSS.  Teknik pengujian yang sering digunakan para peneliti untuk uji validitas adalah menggunakan korelasi Bivariate Pearson (Produk Momen Pearson). Analisis ini dengan cara mengkorelasikan masing-masing skor item dengan skor total. Skor total adalah penjumlahan dari keseluruhan item. Item-item pertanyaan yang berkorelasi signifikan dengan skor total menunjukkan item-item tersebut mampu memberikan dukungan dalam mengungkap apa yang ingin diungkap à Valid. Jika r hitung ≥ r tabel (uji 2 sisi dengan sig. 0,05) maka instrumen atau item-item pertanyaan berkorelasi signifikan terhadap skor total (dinyatakan valid). Langkah-langkah dalam pengujian validitas ini yaitu :

1. Buat skor total masing-masing variabel  (Tabel perhitungan skor)

tabel1

2. Klik Analyze ->  Correlate  ->  Bivariate  (Gambar/Output SPSS)

spss1

3. Masukan seluruh item variabel x ke Variabels

spss2

4. Cek list Pearson ; Two Tailed ; Flag

5. Klik Ok

Tabel rangkuman hasil uji validitas dari variabel tersebut dapat dilihat sebagai berikut :

spss4

Dari tabel diatas dapat dijelaskan bahwa nilai r hitung > r tabel berdasarkan uji signifikan 0.05, artinya bahwa item-item tersebut diatas valid

Rumus Korelasi Product Moment :

spss5

Keterangan :

spss6

source : https://qmc.binus.ac.id/

WHAT DOES CRONBACH’S ALPHA MEAN?

Cronbach’s alpha is a measure of internal consistency, that is, how closely related a set of items are as a group.    It is considered to be a measure of scale reliability. A “high” value for alpha does not imply that the measure is unidimensional. If, in addition to measuring internal consistency, you wish to provide evidence that the scale in question is unidimensional, additional analyses can be performed. Exploratory factor analysis is one method of checking dimensionality. Technically speaking, Cronbach’s alpha is not a statistical test – it is a coefficient of reliability (or consistency).

Cronbach’s alpha can be written as a function of the number of test items and the average inter-correlation among the items.  Below, for conceptual purposes, we show the formula for the Cronbach’s alpha:

α=Nc¯v¯+(N−1)c¯

Here N  is equal to the number of items, c¯ is the average inter-item covariance among the items and v¯ equals the average variance.

One can see from this formula that if you increase the number of items, you increase Cronbach’s alpha. Additionally, if the average inter-item correlation is low, alpha will be low.  As the average inter-item correlation increases, Cronbach’s alpha increases as well (holding the number of items constant).

An example

Let’s work through an example of how to compute Cronbach’s alpha using SPSS, and how to check the dimensionality of the scale using factor analysis. For this example, we will use a dataset that contains four test items – q1q2q3 and q4. You can download the dataset by clicking on https://stats.idre.ucla.edu/wp-content/uploads/2016/02/alpha.sav. To compute Cronbach’s alpha for all four items – q1, q2, q3, q4 – use the reliability command:

RELIABILITY
  /VARIABLES=q1 q2 q3 q4.

Here is the resulting output from the above syntax:

Image alpha1

The alpha coefficient for the four items is .839, suggesting that the items have relatively high internal consistency.  (Note that a reliability coefficient of .70or higher is considered “acceptable” in most social science research situations.)

Hand calculation of Cronbach’s Alpha

For demonstration purposes, here is how to calculate the results above by hand. In SPSS, you can obtain covariances by going to Analyze – Correlate – Bivariate. Then shift q1q2,q3 and q4 to the Variables box and click Options. Under Statistics, check Cross-product deviations and covariances. Click Continue and OK to obtain output.

obtain covariance

Below you will see a condensed version of the output. Notice that the diagonals (in bold) are the variances and the off-diagonals are the covariances. We only need to consider the covariances on the lower left triangle because this is a symmetric matrix.

q1q2q3q4
q1Covariance1.168.557.574.673
q2Covariance.5571.012.690.720
q3Covariance.574.6901.169.724
q4Covariance.673.720.7241.291

Recall that N=4  is equal to the number of items, c¯ is the average inter-item covariance among the items and v¯ equals the average variance. Using the information from the table above, we can calculate each of these components via the following:

v¯=(1.168+1.012+1.169+1.291)/4=4.64/4=1.16.

c¯=(0.557+0.574+0.690+0.673+0.720+0.724)/6=3.938/6=0.656.

α=4(0.656)(1.16)+(4−1)(0.656)=2.624/3.128=0.839.

The results match our SPSS obtained Cronbach’s Alpha of 0.839.

Checking dimensionality

In addition to computing the alpha coefficient of reliability, we might also want to investigate the dimensionality of the scale. We can use the factor command to do this:

FACTOR
 /VARIABLES q1 q2 q3 q4
 /FORMAT SORT BLANK(.35).

Here is the resulting output from the above syntax:

Image alpha2

Looking at the table labeled Total Variance Explained, we see that the eigen value for the first factor is quite a bit larger than the eigen value for the next factor (2.7 versus 0.54). Additionally, the first factor accounts for 67% of the total variance. This suggests that the scale items are unidimensional.

For more information

source : https://stats.idre.ucla.edu/spss/faq/what-does-cronbachs-alpha-mean/

Reliabilitas (indonesia version)

Uji Reliabilitas

Reliabilitas berasal dari kata reliability. Pengertian dari reliability (rliabilitas) adalah keajegan pengukuran (Walizer, 1987). Sugiharto dan Situnjak (2006) menyatakan bahwa reliabilitas menunjuk pada suatu pengertian bahwa instrumen yang digunakan dalam penelitian untuk memperoleh informasi yang digunakan dapat dipercaya sebagai alat pengumpulan data dan mampu mengungkap informasi yang sebenarnya dilapangan. Ghozali (2009) menyatakan bahwa reliabilitas adalah alat untuk mengukur suatu kuesioner yang merupakan indikator dari peubah atau konstruk. Suatu kuesioner dikatakan reliabel atau handal jika jawaban seseorang terhadap pernyataan adalah konsisten atau stabil dari waktu ke waktu. Reliabilitas suatu test merujuk pada derajat stabilitas, konsistensi, daya prediksi, dan akurasi. Pengukuran yang memiliki reliabilitas yang tinggi adalah pengukuran yang dapat menghasilkan data yang reliabel

Menurut Masri Singarimbun, realibilitas adalah indeks yang menunjukkan sejauh mana suatu alat ukur dapat dipercaya atau dapat diandalkan. Bila suatu alat pengukur dipakai dua kali – untuk mengukur gejala yang sama dan hasil pengukuran yang diperoleh relative konsisten, maka alat pengukur tersebut reliable. Dengan kata lain, realibitas menunjukkan konsistensi suatu alat pengukur di dalam pengukur gejala yang sama.

Menurut Sumadi Suryabrata (2004: 28) reliabilitas menunjukkan sejauhmana hasil pengukuran dengan alat tersebut dapat dipercaya. Hasil pengukuran harus reliabel dalam artian harus memiliki tingkat konsistensi dan kemantapan.

Reliabilitas, atau keandalan, adalah konsistensi dari serangkaian pengukuran atau serangkaian alat ukur. Hal tersebut bisa berupa pengukuran dari alat ukur yang sama (tes dengan tes ulang) akan memberikan hasil yang sama, atau untuk pengukuran yang lebih subjektif, apakah dua orang penilai memberikan skor yang mirip (reliabilitas antar penilai). Reliabilitas tidak sama dengan validitas. Artinya pengukuran yang dapat diandalkan akan mengukur secara konsisten, tapi belum tentu mengukur apa yang seharusnya diukur. Dalam penelitian, reliabilitas adalah sejauh mana pengukuran dari suatu tes tetap konsisten setelah dilakukan berulang-ulang terhadap subjek dan dalam kondisi yang sama. Penelitian dianggap dapat diandalkan bila memberikan hasil yang konsisten untuk pengukuran yang sama. Tidak bisa diandalkan bila pengukuran yang berulang itu memberikan hasil yang berbeda-beda.

Tinggi rendahnya reliabilitas, secara empirik ditunjukan oleh suatu angka yang disebut nilai koefisien reliabilitas. Reliabilitas yang tinggi ditunjukan dengan nilai rxx mendekati angka 1. Kesepakatan secara umum reliabilitas yang dianggap sudah cukup memuaskan jika ≥ 0.700.

Pengujian reliabilitas instrumen dengan menggunakan rumus Alpha Cronbach karena instrumen penelitian ini berbentuk angket dan skala bertingkat. Rumus Alpha Cronbach sevagai berikut :

spss7

Keterangan :

spss8

Jika nilai alpha > 0.7 artinya reliabilitas mencukupi (sufficient reliability) sementara jika alpha > 0.80 ini mensugestikan seluruh item reliabel dan seluruh tes secara konsisten memiliki reliabilitas yang kuat. Atau, ada pula yang memaknakannya sebagai berikut:

Jika alpha > 0.90 maka reliabilitas sempurna. Jika alpha antara 0.70 – 0.90 maka reliabilitas tinggi. Jika alpha 0.50 – 0.70 maka reliabilitas moderat. Jika alpha < 0.50 maka reliabilitas rendah. Jika alpha rendah, kemungkinan satu atau beberapa item tidak reliabel.

source : https://qmc.binus.ac.id/

Composite reliability

Composite reliability (sometimes called construct reliability) is a measure of internal consistency in scale items, much like Cronbach’s alpha (Netemeyer, 2003).

It can be thought of as being equal to the total amount of true score variance relative to the total scale score variance (Brunner & Süß, 2005). Alternatively, it’s an “indicator of the shared variance among the observed variables used as an indicator of a latent construct” (Fornell & Larcker, 1981).

Formula

construct composite reliability

Confirmatory Factor Analysis is one way to measure composite reliability, and it is widely available in many different statistical software packages. By hand, the calculations are a little cumbersome. The formula (Netemeyer, 2003) is:


Where:

  • λi = completely standardized loading for the ith indicator,
  • V(δi) = variance of the error term for the ith indicator,
  • p = number of indicators

Thresholds for Composite Reliability

Thresholds for composite reliability are up for debate (a reasonable threshold can be anywhere from .60 and up), with different authors offering different threshold suggestions. A lot depends upon how many items you have in your scale. Smaller numbers of scale items tend to result in lower reliability levels, while larger numbers of scale items tend to have higher levels. That said, Richard Netemeyer and colleagues state in Scaling Procedures: Issues and Applications that it’s “reasonable” for a narrowly defined construct with five to eight items to meet a minimum threshold of .80.

References

Brunner, M. & Süß, H. (2005). Analyzing the Reliability of Multidimensional Measures: An Example from Intelligence Research. Retrieved May 16, 2019 from: http://citeseerx.ist.psu.edu/viewdoc/download?doi=10.1.1.856.4612&rep=rep1&type=pdf
Fornell, C. & Larcker, D. (1981). Evaluating Structural Equation Models with Unobservable Variables and Measurement Error. Journal of Marketing Research Vol. 18, No. 1 (Feb), pp. 39-50.
Ketchen, D. & Berg, D. (2006). Research Methodology in Strategy and Management. Emerald Group Publishing.
Netemeyer, R. et. al, (2003). Scaling Procedures: Issues and Applications. SAGE.CITE THIS AS:
Stephanie Glen. “Composite Reliability: Definition” From StatisticsHowTo.com: Elementary Statistics for the rest of us! https://www.statisticshowto.com/composite-reliability-definition/

What is a hypothesis?

A hypothesis states your predictions about what your research will find. It is a tentative answer to your research question that has not yet been tested. For some research projects, you might have to write several hypotheses that address different aspects of your research question.

A hypothesis is not just a guess — it should be based on existing theories and knowledge. It also has to be testable, which means you can support or refute it through scientific research methods (such as experiments, observations and statistical analysis of data).

Variables in hypotheses

Hypotheses propose a relationship between two or more variables. An independent variable is something the researcher changes or controls. A dependent variable is something the researcher observes and measures.

Daily apple consumption leads to fewer doctor’s visits.

In this example, the independent variable is apple consumption — the assumed cause. The dependent variable is the frequency of doctor’s visits — the assumed effect.

Developing a hypothesis

1. Ask a question

Writing a hypothesis begins with a research question that you want to answer. The question should be focused, specific, and researchable within the constraints of your project.

Do students who attend more lectures get better exam results?

2. Do some preliminary research

Your initial answer to the question should be based on what is already known about the topic. Look for theories and previous studies to help you form educated assumptions about what your research will find.

At this stage, you might construct a conceptual framework to identify which variables you will study and what you think the relationships are between them.

3. Formulate your hypothesis

Now you should have some idea of what you expect to find. Write your initial answer to the question in a clear, concise sentence.

Attending more lectures leads to better exam results.

4. Refine your hypothesis

You need to make sure your hypothesis is specific and testable. There are various ways of phrasing a hypothesis, but all the terms you use should have clear definitions, and the hypothesis should contain:

  • The relevant variables
  • The specific group being studied
  • The predicted outcome of the experiment or analysis

5. Phrase your hypothesis in three ways

To identify the variables, you can write a simple prediction in if…then form. The first part of the sentence states the independent variable and the second part states the dependent variable.

If a first-year student starts attending more lectures, then their exam scores will improve.

In academic research, hypotheses are more commonly phrased in terms of correlations or effects, where you directly state the predicted relationship between variables.

The number of lectures attended by first-year students has a positive effect on their exam scores.

If you are comparing two groups, the hypothesis can state what difference you expect to find between them.

First-year students who attended most lectures will have better exam scores than those who attended few lectures.

6. Write a null hypothesis

If your research involves statistical hypothesis testing, you will also have to write a null hypothesis. The null hypothesis is the default position that there is no association between the variables. The null hypothesis is written as H0, while the alternative hypothesis is H1 or Ha.

H0: The number of lectures attended by first-year students has no effect on their final exam scores.
H1: The number of lectures attended by first-year students has a positive effect on their final exam scores.

source : https://www.scribbr.com/research-process/hypotheses/